Temporal Multi Party Analysis
Applying graph theory to analyze, understand, and predict the time-based behaviour of complex connected systems and entities.
Introduction
Over the last five centuries, human progress in scientific capabilities has led to revolutions in agriculture, transportation, industrial production and information technology. A direct consequence of these revolutions has been greater connectivity between people and the exponential growth of trade in markets across the world. Products and services, both physical and digital, now flow at unprecedented velocity across the planet in a global system of trade and commerce.
As the world has flattened, it has also led to the creation of an environment that amplifies domino effects of disruptive events across complex and interconnected systems. Disruptive events that impact an organization or a business can be triggered anywhere in the world and start small before multiplying rapidly across systems and end up as either an impending threat or an opportunity that requires adaptation and response.
Our recent history is rife with examples of organizations that failed to sense and respond to changes in their environments, ultimately leading to their demise. Polaroid, Blockbuster, Blackberry, Kodak, and several others make up this infamous but growing list of companies.
Disruptions in the environment can range across the spectrum from Ernest Hemingway’s “gradually, then suddenly” events to Nassim Taleb’s “black swan” events. However, organizations that survive will be the ones who can sense early signals across their interconnected environment and proactively adapt the businesses in a world where accelerated change and unprecedented events will be the norm, not an exception.
Therefore, understanding the fragilities of interconnected systems and building the appropriate buffers to weather through crisis or respond to fundamental shifts, has become a necessity for 21st century businesses. No activity in the world takes place in isolation. As we have seen with the recent climate crisis and a global pandemic, what happens in one part of the world invariably has an impact in other parts of the world because we are all part of a complex and connected network.
A new paradigm of strategic intelligence based on the temporal behaviour of connected systems is required by organizations to build a higher order understanding of an unpredictable world and predict how events in the environment will impact the risks and opportunities for their enterprise.
We need to recognize that completeness of knowledge comes from having a hierarchy of perspectives. One can see things from the lens of a microscope, the lens of the human eye, the lens of a telescope, the lens of a satellite, and so forth. Each way of seeing the bigger picture allows our knowledge of the world to become more nuanced and contextually richer over time.
Rapid globalization over the last several decades has given rise to the idea of systems within systems that involve the constant interplay of local, regional and global entities and events with far reaching consequences. Also, our relentless search for greater optimization and efficiencies, such as building ‘just in time’ global supply chains, has interlinked these entities even more tightly together into a complex and coupled web of cause-effect chains.
The digital revolution in the last decade has further amplified the interactions across these systems as information and data fly across the world often faster than the actual physical consequences of the events themselves, acting like the proverbial canary in a coal mine. To navigate in these times, we need strategic intelligence that is based on connected systems thinking, a concept that has been around for decades, but its necessity in developing an understanding of the interconnected world and how risks and opportunities evolve and cascade across the environment, is now more than ever.
The ubiquitous nature of graphs
The first formal concepts in graph theory and the related field of topology were developed in the 18th century by the famous mathematician Leonhard Euler. The basis of graph theory starts with the very elementary idea of a set of nodes that are connected by edges.
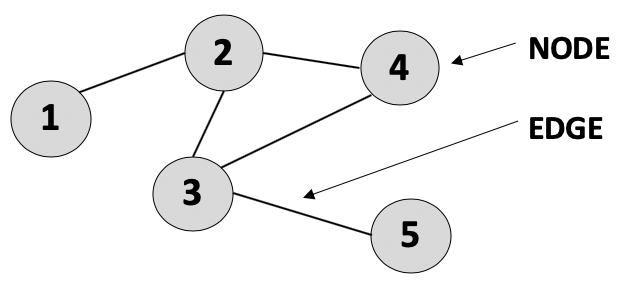
This basic unit has been enriched over time to provide more nuanced representations by including directionality of the edges, weights of the connections and other forms of relationships between the nodes. Therefore, graphs provide a natural, concise and intuitive abstraction for a variety of domains where nodes can represent entities, both physical and abstract, and the edges capture the inherent relationships, direct and cyclical, between entities in interconnected systems.
Another famous mathematician Benoît Mandelbrot developed the idea of fractals and self-similarity in nature, observed in nested structures such as a tree that has many branches, and these are like small trees; further, these large branches have more smaller branches that look like even smaller trees. The idea is that complex higher-level structures emerge from a hierarchy of layers of similar smaller structures and interactions.
As a structure, graphs exhibit the highest degree of fractal similarity and this is what makes them ideal for representing complex multi-layered concepts and connections. The table below highlights a few examples of graph patterns that occur in different domains.

The ubiquity of graph structure and its natural flexibility in representing different orders of complexity for any group of connected entities and concepts is what makes it the ideal choice for modeling and understanding the world in a way that can capture knowledge, both implicitly and explicitly.
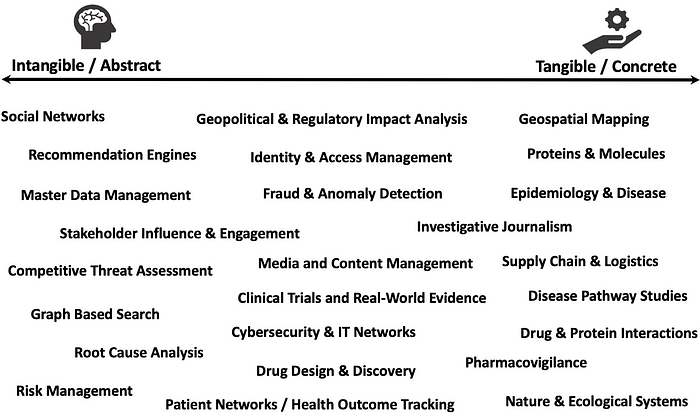
We see that connections exist everywhere, between concrete entities such as molecules, nature, humans, products, customers, factories, supply chains, etc. and abstract concepts such as ideas, knowledge, influence, opinions, risk, etc. Graphs can even be used to bridge the connections between abstract and non-abstract entities. A few domain areas and use cases, not exhaustive by any means, are shown in Figure 2 below to illustrate the extendable nature of graph-based models.
With recent advances in graph databases and analytics technologies that provide a cost-effective storage, computation and analysis platform for representational entities, it is now feasible to build dynamic graphs that capture contextual knowledge of interconnected systems and interactions.
Additionally, a growing field of current Artificial Intelligence (AI) research also pertains to the application of graph models for acquiring knowledge of network structures and their behaviour by embedding the network’s properties into vectors and then applying machine learning techniques for node prediction, node classification, link prediction, community detection, network similarity, etc.
Various mathematical methods and frameworks for Geometric Deep Learning (GDL) and Graph Representation Learning (GRL) are currently being developed to enable machine learning based on the data in the graph and then use it for learning structural features about the graph itself without prior feature engineering. This is a promising novel field of research and could potentially become the basis for generalized AI in the future.
Temporal Multi-Party Analysis (TEMPA) Model
While graphs are a common way of modeling complex systems, and graph neural network models are being used to analyze node properties and graph structure, they often do not address the dynamic time-phased nature of real-world systems. The temporal behaviour in systems is what provides crucial insights about how node-edge behaviour and the entire graph evolves in time.
Therefore, as a complement to ongoing advancements, this article introduces the concept of combining systems thinking and graph-based analysis to create a scalable continuous-time graph representation of complex networks. This Temporal Multi-Party Analysis (TEMPA) model of entities, properties, interconnections and time-phased evolution of system dynamics is used to model temporal behaviour in the network.
Thus, the TEMPA model provides a framework for nudging decisions, influencing stakeholders, simulating scenarios and analyzing cause-effect across complex networks and over time.
All organizations work in the high-level network topology of demand and supply systems as shown below in Figure 3. The management of any enterprise involves orchestration across the overall demand-supply system and the different underlying sub-systems.
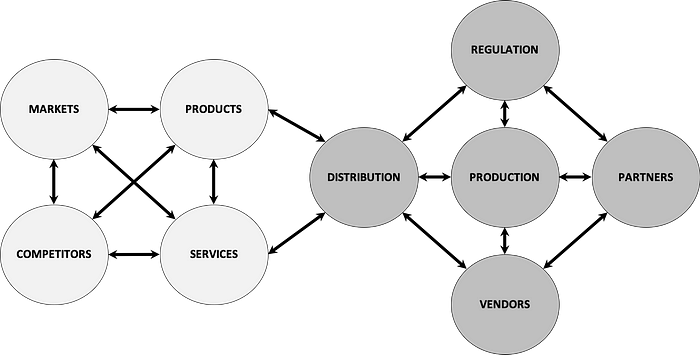
Since the different systems are connected, have layers of sub-systems and feedback loops, any perturbation, internal or external, will trigger disruption which propagates through the system and can lead to either the dynamic equilibrium being maintained or surge and cause cascading non-linear effects.
As illustrated in Figure 4 below, there are various layers of interconnected sub-systems that can be modeled under each of these higher order systems. Changes in the environment have multi-layer effects that travel all the way down, up and across various systems and sub-systems.
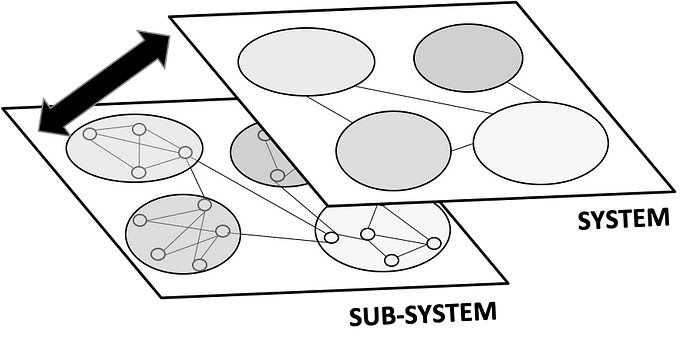
Graphs provides a means for visualizing the system-wide impact of events and pinpointing where and how intervention needs to happen. A sufficiently rich graph representation that models evolution over time of key entities, relationships and context replaces the need for institutional knowledge or ‘gut feeling’ to sense risks and opportunities in the business environment and instead utilizes its deep multi-layered and interconnected systems topology to surface up signals that are critical for attention.
With a sufficiently detailed graph, different algorithms such as eigencentrality, markov chains, minimum cut, louvain clustering, triadic closures, etc. can also be used to find predictive patterns.
The concept introduced in this article focuses on unifying systems thinking, graph theory and current advances in graph representation technologies, to build a context rich Temporal Multi-Party Analysis (TEMPA) model that provides an interconnected representation of the system dynamics and how the network behaves over time.
Temporal Multi-Party Analysis models are useful to simulate complex interdependencies of the real world and aid strategic decision-making by analyzing and visualizing the ‘butterfly effect’ of strategies, events, shocks and triggers across the organization’s network, both internal and external.
The following model specification can be utilized to build a graph for Temporal Multi-Party Analysis (TEMPA):
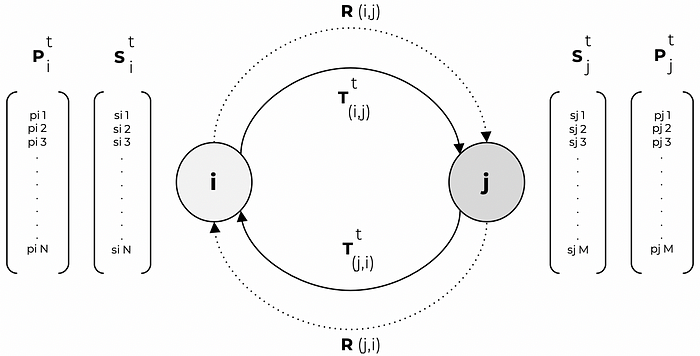
For the figure above,
Let Î = {1,2,3, … ,I} be a set of discrete time intervals and t belongs to Î.
The nodes i and j are vertices (or entities) in a TEMPA graph G, where
S (i)(t) is the state vector (or context) of node i at time t, and
P (i)(t) is the property vector (or behaviour) of node i at time t, and
R (i,j) is the directional relationship between node i and node j, and
T (i,j)(t) is the directional state conductivity (or impact transmission) function between node i and node j at time t.
This is a generalized model that can be used for representation of any number or type of entities, interrelationships, individual states, individual properties as well as the time-phased interactions between the states and properties in an interconnected system.
At any given time t, the above model can be used to represent the dynamics of the system as well as properties of nodes i and j and their current states, which is further determined by the properties and state of all the attached nodes and the cumulative transmission of their effects.
For any dynamic system the properties, states and transmission will evolve with time depending on their mutual relationships and the cascade of impacts from external and internal factors.
The model specification above can be extended in an additive manner to build a complex graph by adding different known entities that comprise a system, their properties, relationships and impact propagation into a time phased knowledge graph. As the system evolves, new entities can be added to the model using the basic building blocks of nodes, relationships, edge propagation functions and the node vectors for properties and states.
A daily life analogy for this model would be how the wear, tear and stress i.e. the time-phased state change of individual beams on a bridge over time, will impact all the other connected beams on the bridge and thereby reduce the properties of strength and load bearing capacity for each of the individual beams as well as the overall system of beams, which is the bridge itself. External factors such as overloaded vehicles, traffic, storms and environment will further deteriorate the state of each of the beams and continue to impact their properties with time.
Intuitively, this graph model is quite analogous to stock and flow concepts from the theory of system dynamics.
Stock: the foundation of any system that is the store or accumulation of either material or information built up over time. In our model these can be represented at a granular level by the property vectors of different nodes or the likelihood of certain conditions being reached at the nodes.
Flow: stocks change in the system over time due to the action of flow to increase or decrease stock in the system, depending on the inflow and outflow. In our model these are represented by the state vectors and transmission functions that control the directional flow from each node to its directly connected nodes.
With a formal topology, when different system and subsystem nodes are connected together based on their relationships, the state vector values of each node will evolve in time as impacts from internal and external events will cause perturbations to propagate across interconnected nodes. These state value changes will then accumulate impact of the disruptions and start changing behaviour of the nodes. As with any interconnected set of entities, there will also be the effect of feedback loops, both stabilizing loops that maintain equilibrium and reinforcing loops that drive nonlinear cascades in the system.
Once the system is modeled with all the relationships, node states and transmission functions, we can then observe systemic behavior of stocks and flows over time to identify strategic nodes that have disproportionate influence on the system behaviour. The graph-based model also provides a way to understand effects at a system level rather than focusing attention on individual causal events. Modeling the impact of signals from external sources and triggers enables strategic impact analysis of environmental shifts and disruptions.
Conclusion
Graphs are a versatile and flexible structure for knowledge representation across a wide variety of domains. This makes them the natural choice for building a framework for Temporal Multi-Party Analysis (TEMPA) that can model the dynamic time-phased evolution of complex system behaviour.
While the concept of graph-based representation has been around for many years, enterprise information technology has primarily been based on tables and relational databases. However, in the last few years there has been rapid advancement in graph technologies and a number of scalable enterprise grade platforms for graph storage, graph computing and graph machine learning have become readily available.
A SaaS platform for building, storing and analyzing TEMPA graph models can be implemented on commonly available and commercial grade graph infrastructures like Neo4j, Janus Graph, Amazon Neptune and Microsoft Cosmos. Advanced analysis techniques for geometric and graph deep learning can also be deployed on the platform by using new open source software libraries such as Pytorch Geometric and Deep Graph Library.
The concept of TEMPA models was inspired by the idea of building a graph-based modeling framework that makes complex knowledge representation, time-phased analysis of connected systems and explainable Artificial Intelligence (AI) accessible to all types of organizations.
TEMPA models can be used in diverse business contexts to build strategic knowledge, reveal hidden patterns, manage risks, uncover opportunities and even be extended to tackle urgent challenges facing our society such as building epidemiological models and contact tracing for infectious diseases.
Here are the 5 main takeaways from this article…
In the past two decades, we have seen rapid and profound changes in the world with dramatic and lasting impact. Remainder of the 21st century will bring even more change that will be accelerated by the interconnectedness of our world.
Organizations need to build strategic capability to understand butterfly effects in a highly connected environment, deploying early interventions to reduce fragility and proactively adapt to shifts in internal and external environments over time.
Graphs provide a natural, flexible and contextual representation for capturing knowledge about the behaviour of entities and networks. Graph models can easily scale up or down depending on the complexity being modeled.
Temporal Multi-Party Analysis (TEMPA) models leverage recent advances in graph technology and machine learning for time-phased representation of complex real-world interactions.
TEMPA models should be implemented for strategic domain areas as a time-phased compass that connects the dots and provides big-picture intelligence on how critical system dynamics and key entities evolve over time.
References
1. D. Watts (2002) A simple model of global cascades on random networks
2. N. Taleb (2012) Antifragile
3. D. H. Meadows (2009) Thinking in systems
4. M. Needham et al. (2019) Graph Algorithms
5. W. L. Hamilton et al. (2018) Representation Learning on Graphs: Methods and Applications
6. K. Xu et al. (2019) How powerful are Graph Neural Networks?
7. A. Hogan et al. (2020) Knowledge Graphs